Python聚类算法之DBSACN实例分析
本文实例讲述了Python聚类算法之DBSACN。分享给大家供大家参考,具体如下:
DBSCAN:是一种简单的,基于密度的聚类算法。本次实现中,DBSCAN使用了基于中心的方法。在基于中心的方法中,每个数据点的密度通过对以该点为中心以边长为2*EPs的网格(邻域)内的其他数据点的个数来度量。根据数据点的密度分为三类点:
核心点:该点在邻域内的密度超过给定的阀值MinPs。
边界点:该点不是核心点,但是其邻域内包含至少一个核心点。
噪音点:不是核心点,也不是边界点。
有了以上对数据点的划分,聚合可以这样进行:各个核心点与其邻域内的所有核心点放在同一个簇中,把边界点跟其邻域内的某个核心点放在同一个簇中。
# scoding=utf-8
import pylab as pl
from collections import defaultdict,Counter
points = [[int(eachpoint.split("#")[0]), int(eachpoint.split("#")[1])] for eachpoint in open("points","r")]
# 计算每个数据点相邻的数据点,邻域定义为以该点为中心以边长为2*EPs的网格
Eps = 10
surroundPoints = defaultdict(list)
for idx1,point1 in enumerate(points):
for idx2,point2 in enumerate(points):
if (idx1 < idx2):
if(abs(point1[0]-point2[0])<=Eps and abs(point1[1]-point2[1])<=Eps):
surroundPoints[idx1].append(idx2)
surroundPoints[idx2].append(idx1)
# 定义邻域内相邻的数据点的个数大于4的为核心点
MinPts = 5
corePointIdx = [pointIdx for pointIdx,surPointIdxs in surroundPoints.iteritems() if len(surPointIdxs)>=MinPts]
# 邻域内包含某个核心点的非核心点,定义为边界点
borderPointIdx = []
for pointIdx,surPointIdxs in surroundPoints.iteritems():
if (pointIdx not in corePointIdx):
for onesurPointIdx in surPointIdxs:
if onesurPointIdx in corePointIdx:
borderPointIdx.append(pointIdx)
break
# 噪音点既不是边界点也不是核心点
noisePointIdx = [pointIdx for pointIdx in range(len(points)) if pointIdx not in corePointIdx and pointIdx not in borderPointIdx]
corePoint = [points[pointIdx] for pointIdx in corePointIdx]
borderPoint = [points[pointIdx] for pointIdx in borderPointIdx]
noisePoint = [points[pointIdx] for pointIdx in noisePointIdx]
# pl.plot([eachpoint[0] for eachpoint in corePoint], [eachpoint[1] for eachpoint in corePoint], 'or')
# pl.plot([eachpoint[0] for eachpoint in borderPoint], [eachpoint[1] for eachpoint in borderPoint], 'oy')
# pl.plot([eachpoint[0] for eachpoint in noisePoint], [eachpoint[1] for eachpoint in noisePoint], 'ok')
groups = [idx for idx in range(len(points))]
# 各个核心点与其邻域内的所有核心点放在同一个簇中
for pointidx,surroundIdxs in surroundPoints.iteritems():
for oneSurroundIdx in surroundIdxs:
if (pointidx in corePointIdx and oneSurroundIdx in corePointIdx and pointidx < oneSurroundIdx):
for idx in range(len(groups)):
if groups[idx] == groups[oneSurroundIdx]:
groups[idx] = groups[pointidx]
# 边界点跟其邻域内的某个核心点放在同一个簇中
for pointidx,surroundIdxs in surroundPoints.iteritems():
for oneSurroundIdx in surroundIdxs:
if (pointidx in borderPointIdx and oneSurroundIdx in corePointIdx):
groups[pointidx] = groups[oneSurroundIdx]
break
# 取簇规模最大的5个簇
wantGroupNum = 3
finalGroup = Counter(groups).most_common(3)
finalGroup = [onecount[0] for onecount in finalGroup]
group1 = [points[idx] for idx in xrange(len(points)) if groups[idx]==finalGroup[0]]
group2 = [points[idx] for idx in xrange(len(points)) if groups[idx]==finalGroup[1]]
group3 = [points[idx] for idx in xrange(len(points)) if groups[idx]==finalGroup[2]]
pl.plot([eachpoint[0] for eachpoint in group1], [eachpoint[1] for eachpoint in group1], 'or')
pl.plot([eachpoint[0] for eachpoint in group2], [eachpoint[1] for eachpoint in group2], 'oy')
pl.plot([eachpoint[0] for eachpoint in group3], [eachpoint[1] for eachpoint in group3], 'og')
# 打印噪音点,黑色
pl.plot([eachpoint[0] for eachpoint in noisePoint], [eachpoint[1] for eachpoint in noisePoint], 'ok')
pl.show()
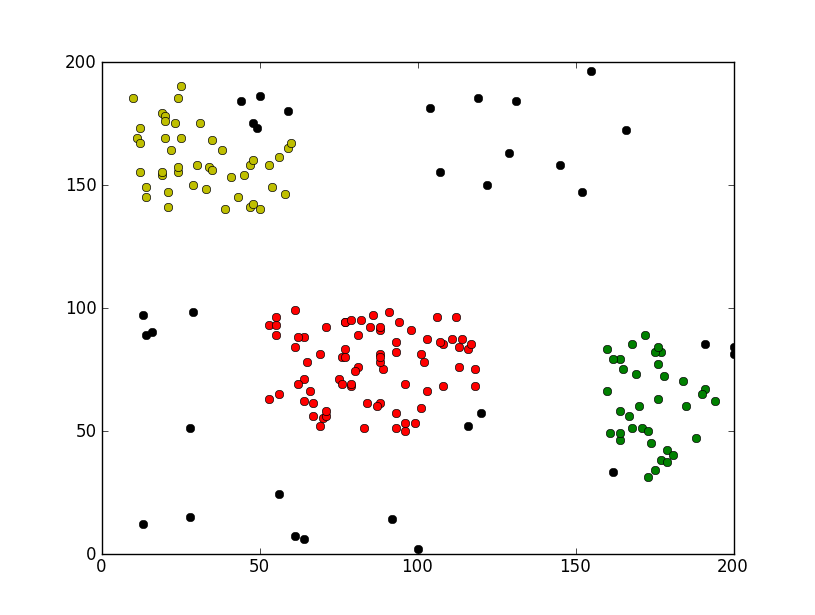
运行效果截图如下:
希望本文所述对大家Python程序设计有所帮助。
CDA数据分析师考试相关入口一览(建议收藏):
▷ 想报名CDA认证考试,点击>>>
“CDA报名”
了解CDA考试详情;
▷ 想学习CDA考试教材,点击>>> “CDA教材” 了解CDA考试教材;
▷ 想加入CDA考试题库,点击>>> “CDA题库” 了解CDA考试题库;
▷ 想了解CDA考试含金量,点击>>> “CDA含金量” 了解CDA考试详情;
▷ 想了解CDA院校合作,点击>>> “院校合作” 了解咨询CDA院校合作;


 京公网安备 11010802034615号
经营许可证编号:京B2-20210330
京公网安备 11010802034615号
经营许可证编号:京B2-20210330