来源:数据STUDIO
作者:云朵君
一、数据获取
通过爬取全国城市在售预售新盘,下面以获取单个城市为例,介绍爬取数据部门主要代码。完整代码见文末获取方式。
本次爬虫使用到的模块有requests_html、requests_cache、bs4.BeautifulSoup、re等。若各位小伙伴们不太熟悉各个模块,可以在文末推荐阅读链接直达文章。
1、定义函数
定义好获取每个项目信息的函数。
def get_house_status(soup):   """
  获取房屋状态信息
  """     house_status = []
    status = soup.find_all(attrs={'class': 'fangyuan'})
    for state in status:
        _status = state.span.text
        house_status.append(_status)
    return house_status def get_house_price(soup):   """
  获取房屋价格信息
  """     house_price = []
    regex = re.compile('s(S+)s')
    prices = soup.find_all(attrs={'class': 'nhouse_price'})
    for price in prices:
        _prices = regex.findall(price.text)
        _price = ''         if _prices[0] == '价格待定':
            pass         else:
            p = _prices[0].split('元')[0]
            if '万' in p:
                _price = p + '元/套'             else:
                _price = p + '元/m2'         house_price.append(_price)
    return house_price def get_house_address(soup, c_city):   """
  获取房屋地址信息
  """     house_address = []
    region = []
    regex = re.compile('s(S+)s')
    addresses = soup.find_all(attrs={'class': 'address'})
    for address in addresses:
        _address = regex.findall(address.text)
        if len(_address) > 1:
            region.append(_address[0].split('[')[1].split(']')[0])
        else:
            region.append(c_city)
        house_address.append(address.a['title'])
    return region, house_address def get_house_type(soup):   """
  获取房屋类型信息
  """     house_type = []
    regex = re.compile('s(S+)s')
    house_types = soup.find_all(attrs={'class': 'house_type clearfix'})
    for _house_type in house_types:
        type_list = regex.findall(_house_type.text)
        type_str = ''         for i in type_list:
            type_str += i
        house_type.append(type_str)
    return house_type def get_house_name(soup):   """
  获取项目名称信息
  """     house_name = []
    regex = re.compile('s(S+)s')
    nlcd_names = soup.find_all(attrs={'class': 'nlcd_name'})
    for nlcd_name in nlcd_names:
        name = ''         names = regex.findall(nlcd_name.text)

        if len(names) > 1:
            for n in names:
                name += n
            house_name.append(name)
        else:
            house_name.extend(names)
    return house_name
2、获取数据的主函数
def get_data(c_city, city, start_page, cache): """
获取数据
""" requests_cache.install_cache()
requests_cache.clear()
session = requests_cache.CachedSession() session.hooks = {'response': make_throttle_hook(np.random.randint(8, 12))} print(f'现在爬取{c_city}'.center(50, '*'))
last_page = get_last_page(city)
print(f'{c_city}共有{last_page}页')
time.sleep(np.random.randint(15, 20))
df_city = pd.DataFrame()
user_agent = UserAgent().random
for page in range(start_page, last_page):
try:
cache['start_page'] = page
print(cache)
cache_json = json.dumps(cache, ensure_ascii=False)
with open('cache.txt', 'w', encoding='utf-8') as fout:
fout.write(cache_json)
print(f'现在爬取{c_city}的第{page + 1}页.')
if page == 0:
df_city = pd.DataFrame()
else:
df_city = pd.read_csv(f'df_{c_city}.csv', encoding='utf-8')
url = html_url(city, page + 1)
if page % 2 == 0:
user_agent = UserAgent().random
header = {"User-Agent": user_agent}
res = session.post(url, headers=header)
if res.status_code == 200:
res.encoding = 'gb18030' soup = BeautifulSoup(res.text, features='lxml')
region, house_address = get_house_address(soup, c_city)
house_name = get_house_name(soup)
house_type = get_house_type(soup)
house_price = get_house_price(soup)
house_status = get_house_status(soup)
df_page = to_df(c_city,
region,
house_name,
house_address,
house_type,
house_price,
house_status)
df_city = pd.concat([df_city, df_page])
df_city.head(2)
time.sleep(np.random.randint(5, 10))
df_city.to_csv(f'df_{c_city}.csv',
encoding='utf-8',
index=False)
except:
df_city.to_csv(f'df_{c_city}.csv', encoding='utf-8', index=False)
cache_json = json.dumps(cache, ensure_ascii=False)
with open('cache.txt', 'w', encoding='utf-8') as fout:
fout.write(cache_json)
return df_city
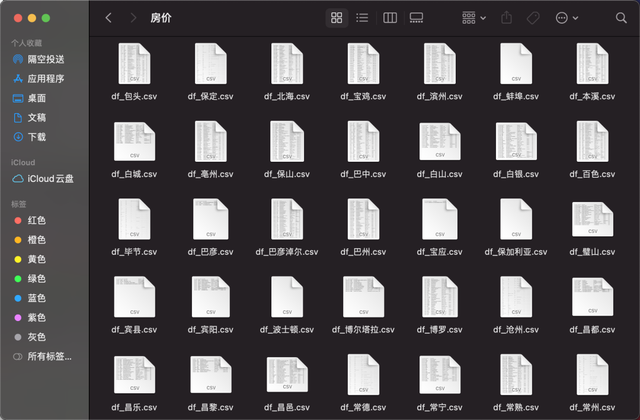
爬取过程中,将每个城市单独保存为一个csv文件:
3、合并数据
import os import pandas as pd
df_total = pd.DataFrame() for root, dirs, files in os.path.walk('./全国房价数据集'):
   for file in files:
       split_file = os.path.splitext(file)
        file_ext = split_file[1]
        if file_ext == '.csv':
           path = root + os.sep + file
           df_city = pd.read_csv(path, encoding='utf-8')
           df_total = pd.concat([df_total, df_city])
    df_total.to_csv(root+os.sep+'全国新房202102.csv', encoding='utf-8', index=False)
1、导入需要用的模块
import pandas as pd import numpy as np import matplotlib.pyplot as plt import seaborn as sns import missingno as msno
2、读取数据
raw_data = pd.read_csv('全国新房202102.csv', encoding='utf-8')
raw_data.sample(5)
3、查看下数据基本情况
>>> raw_data.shape
(54733, 7) >>> len(raw_data.city.drop_duplicates()) 581
爬取了全国581个城市,共计54733个在售、预售房产项目。
由于获取到的数据存在缺失值、异常值以及不能直接使用的数据,因此在分析前需要先处理缺失值、异常值等,以便后续分析。
4、缺失值分析
msno.matrix(raw_data)
整体来看,处理house_price存在缺失值,这是因为这部分楼盘是预售状态,暂未公布售价。
5、house_type
再仔细分析,house_price有两种形式
除了预售缺失值外,有单价和总价两种,为方便统计,需将总价除以面积,将价格统一为单均价。因此需要对户型house_type进行处理,如下:
def deal_house_type(data):
    res = []
    if data is np.nan:
        return [np.nan, np.nan, np.nan]
    else:
        if '-'in data:
            types = data.split('-')[0]
            areas = data.split('-')[1]
            area = areas.split('~')
            if len(area) == 1:
                min_area = areas.split('~')[0][0:-2]
                max_area = areas.split('~')[0][0:-2]
            else:
                min_area = areas.split('~')[0]
                max_area = areas.split('~')[1][0:-2]

            res = [types, int(min_area), int(max_area)]
            return res
        else:
            return [np.nan, np.nan, np.nan]
series_type = raw_data.house_type.map(lambda x: deal_house_type(x))
df_type = pd.DataFrame(series_type.to_dict(), index=['house_type', 'min_area', 'max_area']).T
data_type = pd.concat([data_copy.drop(labels='house_type',axis=1), df_type], axis=1)
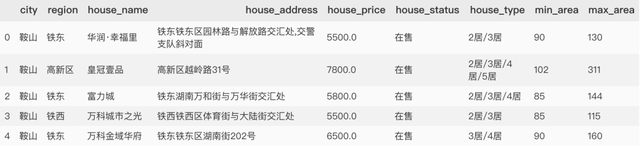
data_type.head()
得到下表
6、house_price
得到户型面积后,接下来处理房屋价格。
def deal_house_price(data):
    try:
        if data.house_price is np.nan:
            return np.nan
        else:
            if "价格待定" in data.house_price:
                return np.nan

            elif "万" not in data.house_price:
                price = int(data.house_price.split('元')[0])
            else:
                price_total = int(float(data.house_price.split('万')[0])* 10000)
                if data.min_area is np.nan and data.max_area is np.nan:
                    return np.nan
                elif data.min_area is np.nan:
                    price = price_total/ data.max_area
                elif data.max_area is np.nan:
                    price = price_total / data.min_area
                else:
                    price = price_total / (data.min_area + data.max_area)
        return int(price)
    except:
        return np.nan
series_price = data_type.apply(lambda x:deal_house_price(x), axis=1 )
data_type['house_price'] = series_price
data_type.head()
得到结果
7、缺失值处理
data = data_type.copy()
# 房价缺失值用0填充 data['house_price'] = data_type.house_price.fillna(0) data['house_type'] = data_type.house_type.fillna('未知')
8、异常值分析
data.describe([.1, .25, .5, .75, .99]).T
很明显有个缺失值,查看原网页,此数值因较特殊,清洗过程中多乘100000,因此直接将此值更改过来即可。
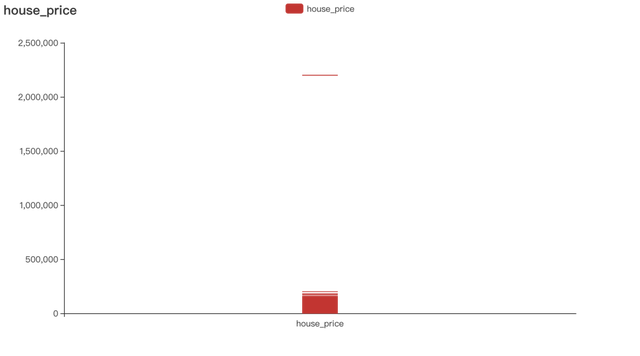
还可以通过可视化(箱图)的方式查看异常值。
from pyecharts import options as opts
from pyecharts.charts import Boxplot

v = [int(i) for i in data.house_price] c = Boxplot() c.add_xaxis(["house_price"]) c.add_yaxis("house_price", v) c.set_global_opts(title_opts=opts.TitleOpts(title="house_price")) c.render_notebook()
三、可视化分析
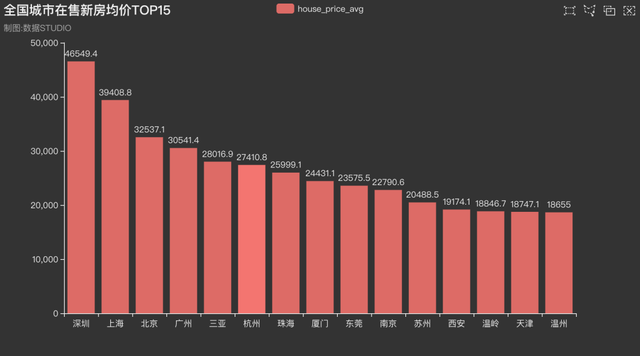
1、全国城市在售新房均价TOP15
全国城市新房均价分析,房价是我们最关心的一个特征之一,因此看下全国均价最高的是哪几个城市。
data1 = data.query('house_price != 0')
data_pivot = data1.pivot_table(values='house_price',
                               index='city').sort_values(by='house_price',
                                                         ascending=False)
data_pivot
2、全国城市在售新房均价条形图
from pyecharts.charts import Bar
from pyecharts.globals import ThemeType

x_axis = [i for i in data_pivot.index[0:15]]
y_axis = [round(float(i), 1) for i in data_pivot.house_price.values[0:15]] c = (
    Bar({"theme": ThemeType.DARK})
    .add_xaxis(x_axis)
    .add_yaxis("house_price_avg", y_axis)
    .set_global_opts(
        title_opts=opts.TitleOpts(title="全国城市在售新房均价TOP15", subtitle="数据: STUDIO"),
        brush_opts=opts.BrushOpts(),
    )
) c.render_notebook()
结果如下,排名前面的一直都是深圳、北京、上海等一线城市。
3、全国房价地理位置图
import pandas as pd from pyecharts.globals import ThemeType, CurrentConfig, GeoType from pyecharts import options as opts from pyecharts.charts import Geo datas = [(i, int(j)) for i, j in zip(data_pivot.index, data_pivot.values)] geo = (Geo(init_opts=opts.InitOpts(width='1000px',
height='600px',
theme=ThemeType.PURPLE_PASSION),
is_ignore_nonexistent_coord = True)
.add_schema(maptype='china',
label_opts=opts.LabelOpts(is_show=True)) .add('均价',
data_pair=datas,
type_=GeoType.EFFECT_SCATTER,
symbol_size=8,
)
.set_series_opts(label_opts=opts.LabelOpts(is_show=False))
.set_global_opts(
title_opts=opts.TitleOpts(title='全国城市在售新房均价', subtitle="制图: 数据STUDIO"),
visualmap_opts=opts.VisualMapOpts(max_=550,
is_piecewise=True,
pieces=[
{"max": 5000, "min": 1000, "label": "1000-5000", "color": "#708090"},
{"max": 10000, "min": 5001, "label": "5001-10000", "color": "#00FFFF"},
{"max": 20000, "min": 10001, "label": "10001-20000", "color": "#FF69B4"},
{"max": 30000, "min": 20001, "label": "20001-30000", "color": "#FFD700"},
{"max": 40000, "min": 30001, "label": "30001-40000", "color": "#FF0000"},
{"max": 100000, "min": 40001, "label": "40000-100000", "color": "#228B22"},])
)
)
geo.render('全国城市在售新房均价.html')
近年来,火热的楼市价格一路飙升,为了稳定房价,各地政府相继出台各项调控政策。据统计,今年内全国各地累计出台楼市调控政策次数已高达97次(近100次),其中,1月份单月全国各地楼市调控政策次数高达42次,2月份比1月份多3次,共计45次。
4、全国新房项目总数排行榜
接下来看看全国在售预售新房项目总数排行TOP20,排在前五的分别是四川成都--1000个,重庆--938个,湖北武汉--859个,陕西西安--840个,河南郑州--822个,均是新一线城市(成都、杭州、重庆、武汉、苏州、西安、天津、南京、郑州、长沙、沈阳、青岛、宁波、东莞和无锡)。
现在的新一线城市经济发展速度较快,未来发展前景广阔,可以说是仅次于北上广深。人口都在持续流入,人口流入将会增加对于房产的需求,房产需求增长将会让房产价格稳步攀升。也是很值得投资的。
from pyecharts import options as opts from pyecharts.charts import Bar

city_counts = data.city.value_counts()[0:20]
x_values = city_counts.index.to_list()
y_values = [int(i) for i in city_counts.values]

bar = (
    Bar()
    .add_xaxis(x_values)
    .add_yaxis("",y_values,itemstyle_opts=opts.ItemStyleOpts(color="#749f83"))
    .set_global_opts(title_opts=opts.TitleOpts(title="全国新房项目总数TOP20"),
                     toolbox_opts=opts.ToolboxOpts(),
                     legend_opts=opts.LegendOpts(is_show=False),
                    datazoom_opts=opts.DataZoomOpts(),)
)
bar.render_notebook()
结果
5、城市各行政区在售新房均价
以在售/预售房产项目最多的成都为例,看城市各行政区在售新房均价。
在"住房不炒"的大环境下,各大城市限购政策越来越严格。近日成都更是实行购房资格预审,热点楼盘优先向无房居民家庭销售,是我们这些刚需的一大福音。接下来一起看看吧。
成都各行政区在售新房均价
data2 = data.query('house_price != 0 and city=="成都"')
data_pivot_cd = data2.pivot_table(values='house_price',
                               index='region').sort_values(by='house_price')
x_axis2 = [i for i in data_pivot_cd.index[10:]]
y_axis2 = [round(float(i), 1) for i in data_pivot_cd.house_price.values[10:]]
c = (
    Bar({"theme": ThemeType.DARK})
    .add_xaxis(x_axis2)
    .add_yaxis(
CDA数据分析师考试相关入口一览(建议收藏):
▷ 想报名CDA认证考试,点击>>>
“CDA报名”
了解CDA考试详情;
▷ 想学习CDA考试教材,点击>>> “CDA教材” 了解CDA考试教材;
▷ 想加入CDA考试题库,点击>>> “CDA题库” 了解CDA考试题库;
▷ 想了解CDA考试含金量,点击>>> “CDA含金量” 了解CDA考试详情;
▷ 想了解CDA院校合作,点击>>> “院校合作” 了解咨询CDA院校合作;


 京公网安备 11010802034615号
经营许可证编号:京B2-20210330
京公网安备 11010802034615号
经营许可证编号:京B2-20210330